


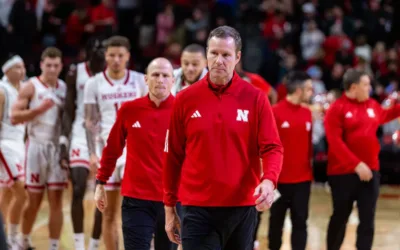
2024 Nebraska Men’s Basketball Offseason Tracker
The 2023-24 Nebraska men's basketball season came to an end in the first round of the NCAA Tournament, but there's no such thing as a true offseason in college basketball these days. Coach Fred Hoiberg and his staff are already hard at work building the roster to make...
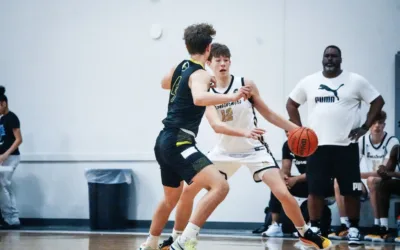
Cedar Falls Sophomore Gerdes Building Relationship With Huskers
William Gerdes, one of the top high school prospects in Iowa, has a budding relationship with Nebraska. Nebraska was the first to offer Gerdes, a 2026 forward from Cedar Falls High School, a scholarship in November, and Hail Varsity caught up with him at a recent AAU...
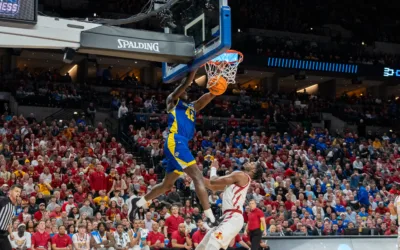
William Kyle III Visits Nebraska
William Kyle III is one of the most sought-after names in the Division I transfer portal. After two seasons at South Dakota State during which the 6-foot-9, 230-pound forward developed into a first-team All-Summit performer, Summit League Defensive Player of the Year...
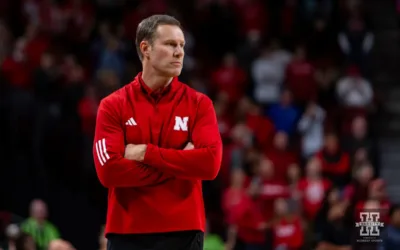
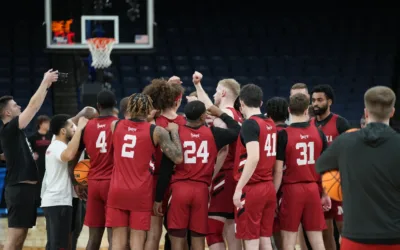
Husker Hoops: Staying, Going, Portalling
Nebraska’s season came to a less than dramatic end Friday night with a 98-83 first-round NCAA Tournament loss to Texas A&M. The Husker hoops roster rebuild has already begun for the 2024-25 season. A promising start of the game with Keisei Tominaga raining...
No. 8 Nebraska Opens NCAA Tournament Thursday Against No. 9 Texas A&M
Nebraska men’s basketball is in the NCAA Tournament for the first time since 2014. The No. 8 seed Huskers (23-10) will face No. 9 seed Texas A&M (20-14) on Friday at 5:50 CT at FedExForum in Memphis, Tennessee. The game will be televised on TNT and feature Spero...

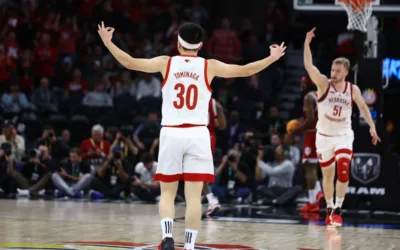
Huskers Fall To Illinois in Big Ten Semifinals
MINNEAPOLIS — Nebraska men’s basketball fell 98-87 to Illinois in the Big Ten Tournament semifinals Saturday. It was a tale of two halves for the Huskers and Terrence Shannon Jr. put on a show for the Illini. Shannon set the Big Ten Tournament single-game scoring...
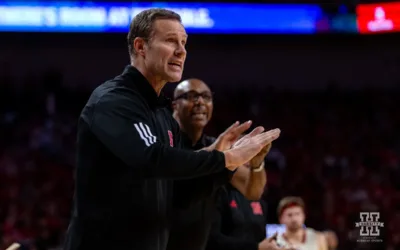
Huskers Hammer Hoosiers; Will Play Illini in Big Ten Semis
MINNEAPOLIS — Nebraska men’s basketball didn’t just defeat Indiana in the Big Ten Quarterfinals, the Huskers hammered the Hoosiers 93-66 in the nightcap Friday in Minneapolis. The win improves Nebraska to 23-9 on the season and sends the Huskers to the Big Ten...
Huskers Set to Face Hoosiers In Big Ten Quarterfinals
Nebraska men’s basketball will start its 2024 Big Ten Tournament run Friday against Indiana. Tipoff is set for 8 p.m. and the game will be televised on Big Ten Network with Brandon Gaudin and Robbie Hummel on the call. The Huskers are 2-0 against Indiana this...
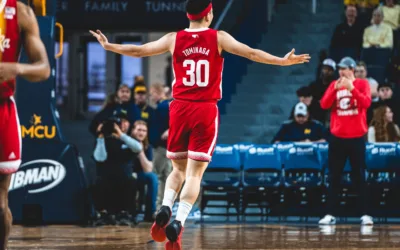
Huskers Make History, Win at Michigan
Nebraska men’s basketball finished the regular season with an 85-70 win at Michigan on Sunday. The win improves Nebraska to 22-9 on the season and 21-8 overall in the Big Ten and is the first time in program history Nebraska has won at Michigan (1-12). 22 wins ties...
Subscribe To Our Newsletter
Get bi-weekly emails from Mike Babcock about Nebraska history and what’s top of mind for him in Husker athletics each week.