


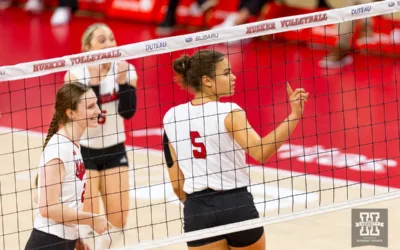
Allick Back to Work After Offseason of Reflection
Those who attend Husker volleyball matches at the Devaney Center this fall might notice a change during lineup announcements. No. 5 is Bekka Allick no longer; instead, fans will hear her full name: Rebekah. She’s already made the change on her social media accounts,...
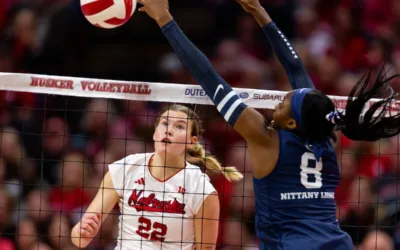
Lindsay Krause Back for Huskers After Season-Ending Injury
On Oct. 9, 2023, Lindsay Krause earned Big Ten Player of the Week after dropping 24 kills on .458 hitting and four aces in a pair of Husker wins the previous week. Later that week, she put up 13 kills on .300 hitting and two aces in a sweep over Penn State. The...
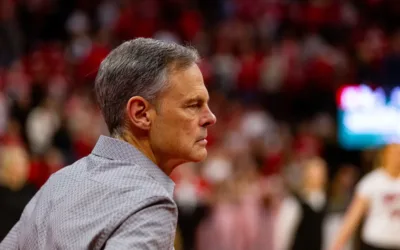
Freshmen Pierce, Mauch Highlight of Spring Volleyball Practice
Coach John Cook is bringing the majority of his lineup back from the 2023 national runner-up Huskers, but it’s been two newcomers who have stood out the most so far this spring. Between the beach season and start of indoor spring training, freshmen Skyler Pierce and...

Taylor Landfair Excited to Join Competitive Husker Gym
Nebraska volleyball made a big splash in the transfer portal earlier this month when former Minnesota outside hitter and 2022 Big Ten Player of the Year Taylor Landfair announced her commitment to the Huskers. Landfair recently joined Hurrdat Sports’ Ana Bellinghausen...
Huskers Feature Prominently in Winter Transfer Portal Movement
The first postseason transfer portal window for Division I volleyball closed on Monday, Jan. 1, and it’s been a busy time for the Cornhuskers. All 14 players on the 2023 roster were eligible to return in 2024, but a 100% retention rate is almost unheard of in college...
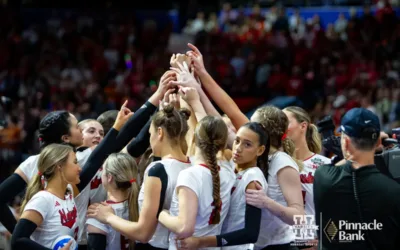
On Present Nebraska Heartbreak and Hope for the Future
Jacob Padilla put a bow on the 2023 Nebraska volleyball season, touching on what made this team special despite the way its final match went.
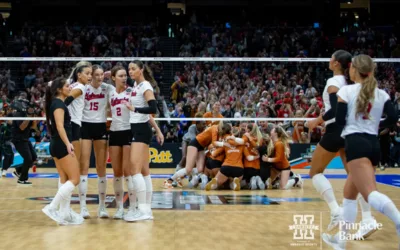
Texas Dominates Serve and Pass Game to Sweep Nebraska in Title Match
Texas used a dominant serving effort to sweep Nebraska 25-22, 25-14, 25-11, claiming the Longhorns’ second straight national title.
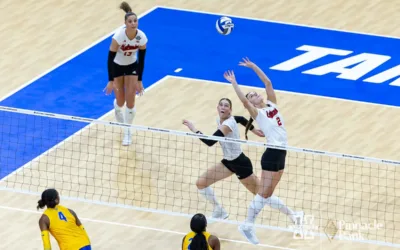
Nebraska, Texas Set to Renew Rivalry in National Championship
Nebraska and Texas are set to renew their rivalry in Tampa on Sunday with the National Championship on the line.
Reilly, Swindle Competing to Join Exclusive Club Sunday
Either Bergen Reilly or Ella Swindle will join the exclusive club of freshman setters to guide her team to a national title on Sunday.
Subscribe To Our Newsletter
Get bi-weekly emails from Mike Babcock about Nebraska history and what’s top of mind for him in Husker athletics each week.